Elevate analytics
The Analytics page shows the impact and return on investment of Elevate across your communities. It tells you how fast Elevate reaches a verdict, how many true and false positives it qualifies, how many tokens it uses and how often its verdicts match the ones your analysts set.
Prerequisites
- Elevate is activated on your workspace or community. See Activate Elevate on a workspace.
- Your role includes the Read AI investigations permission, in the AI permission group.
Open the Analytics page
In the left menu, open the Delegate section, which sits above Investigate by default, and select Analytics.
The page has three parts:
| Part | Content | Period covered |
|---|---|---|
| Last 30 days | Three headline metrics with their trend. | The last 30 days, fixed. |
| Performance trends | Three charts on speed, volume and token usage. | The period you select in Trends over time. |
| Investigation quality | Accuracy of Elevate verdicts against analyst verdicts. | The period you select in Trends over time. |
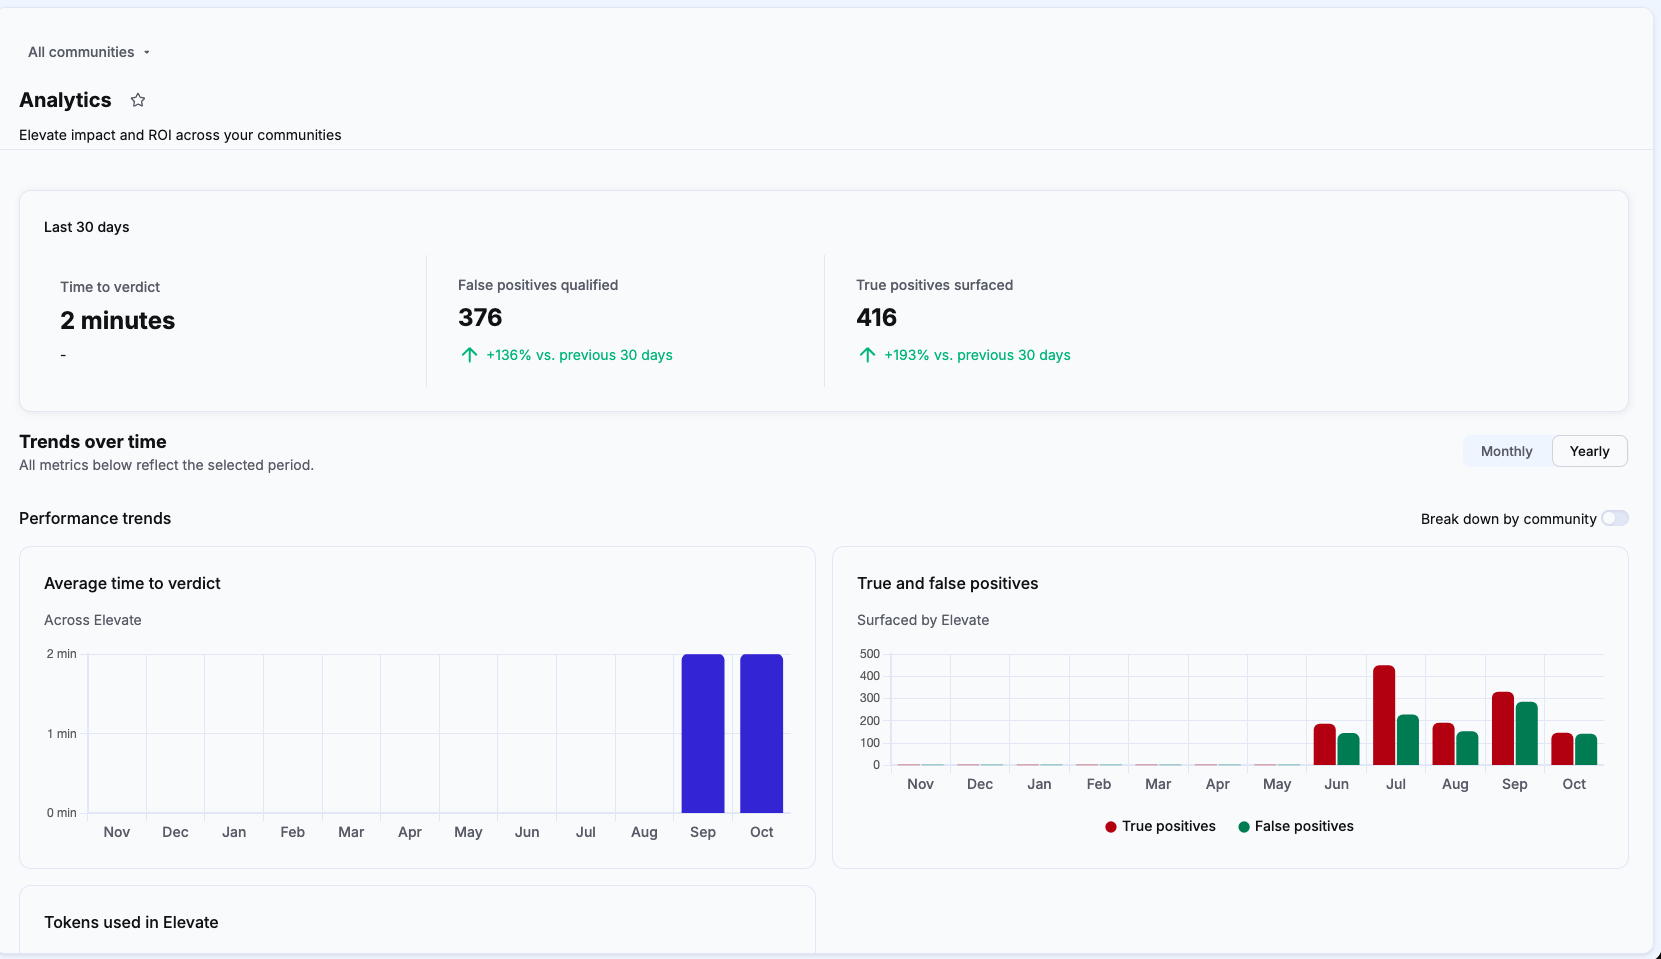
Last 30 days
The Last 30 days block summarizes Elevate activity over the last 30 days.
| Metric | Definition |
|---|---|
| Time to verdict | Average time Elevate takes to reach a verdict on the alerts it investigated. |
| False positives qualified | Number of alerts Elevate qualified as false positives. |
| True positives surfaced | Number of alerts Elevate qualified as true positives. |
Each metric displays a trend value that compares it with the previous 30-day period, for example +136% vs. previous 30 days. When there is no difference to report, the trend displays -.
Fixed period
The Last 30 days block always covers the last 30 days. The period selector and the Break down by community toggle do not change it.
Trends over time
The Trends over time section sets the period and the level of detail for every chart and metric displayed below it.
Select a period
| Mode | Period displayed | Granularity |
|---|---|---|
| Yearly | The last 12 months. | One bar per month. |
| Monthly | The month you select in the month list. | One bar per day. |
To display a specific month, select Monthly, then select the month in the list.
Break down by community
If you manage several communities, enable the Break down by community toggle to split each chart by community. Each bar becomes a stack with one segment per community. The charts name the top 3 communities and group all the other ones under Others.
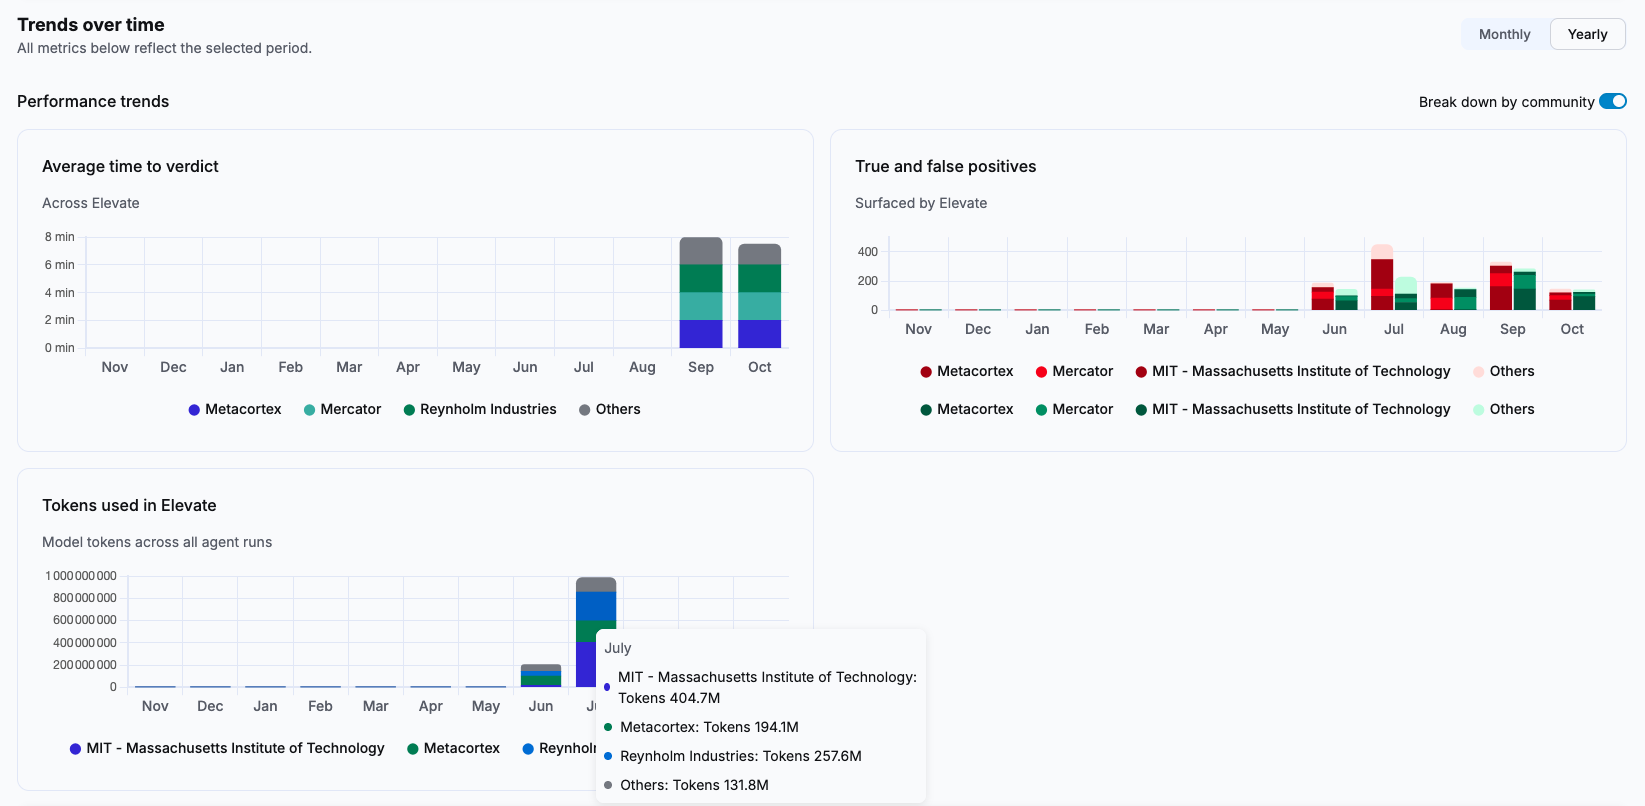
Performance trends
The Performance trends section contains three charts.
| Chart | What it shows | Unit |
|---|---|---|
| Average time to verdict | Average time to verdict across Elevate investigations. | Minutes |
| True and false positives | True positives and false positives surfaced by Elevate, as two series. | Number of alerts |
| Tokens used in Elevate | Model tokens consumed across all agent runs. | Tokens |
Read the chart tooltips
Hover over a bar to display its exact values. The tooltip content depends on the period mode and on the Break down by community toggle.
| Chart | Without breakdown | With Break down by community |
|---|---|---|
| Average time to verdict | The average time to verdict for the day or the month. | The average time to verdict of each of the top 3 communities and of Others. |
| True and false positives | The number of true positives and the number of false positives. | For true positives, then for false positives: the count per community and for Others, followed by a Total. |
| Tokens used in Elevate | The number of tokens, abbreviated, for example 988.2M. | The number of tokens per community and for Others. |
The tooltip title is the day, for example October 9, in Monthly mode and the month, for example July, in Yearly mode.
Investigation quality
The Investigation quality section compares the verdicts Elevate reached with the verdicts your analysts set. It answers one question: when your team closes an alert, does it agree with Elevate?
Population measured
Investigation quality is measured on alerts closed with a custom status. The number of alerts taken into account is displayed under the widgets, next to Population.
Accuracy metrics
Four widgets measure accuracy. Hover over the info button next to a metric name to display its explanation in the product.
| Metric | Definition |
|---|---|
| Verdict stage accuracy | Share where Elevate landed in the same verdict stage as your analyst, even if the exact verdict differed. |
| Verdict accuracy | Share where Elevate and your analyst selected the exact same verdict. |
| Predicted true positives rate | Among the alerts Elevate triaged as true positives, share that your analysts also closed as true positives. |
| Predicted false positives rate | Among the alerts Elevate triaged as false positives, share that your analysts also closed as false positives. |
Verdict stage
A verdict stage is the group a verdict belongs to: True positive or False positive. Two different custom verdicts, for example "Confirmed malware" and "Policy violation", can belong to the same verdict stage. See Custom verdicts.
Agreement breakdown
Next to the accuracy widgets, three bars split the population by level of agreement. Each bar displays the number of alerts and their share of the population.
| Bar | Meaning | Related metric |
|---|---|---|
| Agreement | The analyst used the agent verdict to close. | Same share as Verdict accuracy. |
| Different verdict, same stage | The analyst changed the verdict, but it stayed in the same verdict stage. | Added to Agreement, it gives Verdict stage accuracy. |
| Disagreement | Different verdict and different verdict stage. | The remaining share. |
Reading the breakdown
On a population of 3 closed alerts:
- Agreement: 1, which is 33%
- Different verdict, same stage: 2, which is 67%
- Disagreement: 0, which is 0%
Verdict accuracy is 33% and Verdict stage accuracy is 100%. Elevate always identified whether the alert was a true or a false positive, but your analysts picked a more specific verdict two times out of three.
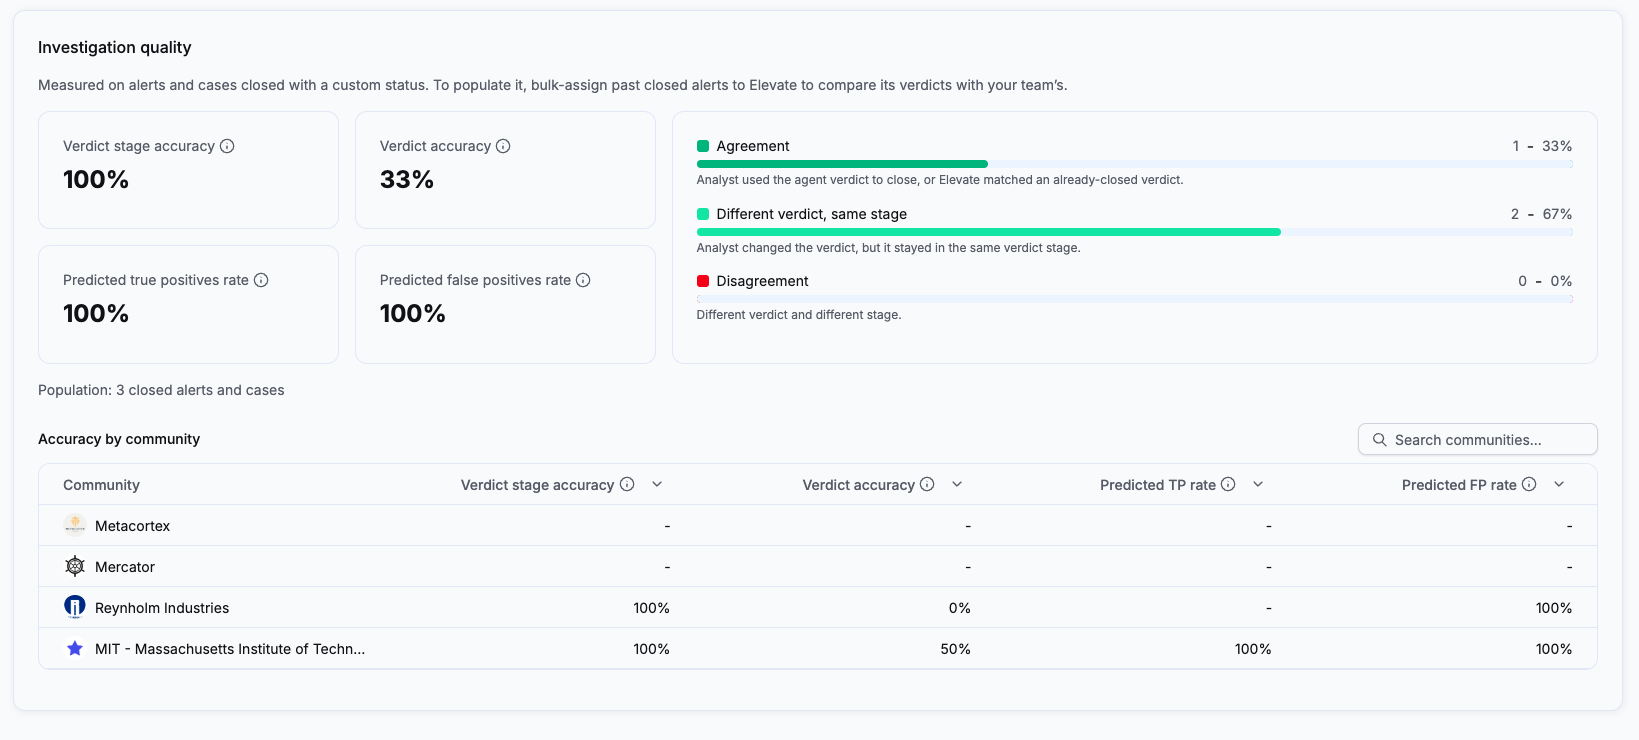
Accuracy by community
If you manage several communities, the Accuracy by community table displays the four accuracy metrics for each community: Verdict stage accuracy, Verdict accuracy, Predicted TP rate and Predicted FP rate.
- To find a community, enter its name in the Search communities field.
- To sort the table, click the arrow in a column header.
- To display the explanation of a metric, hover over the info button in its column header.
A metric displays - when the community has no closed alert to measure it on.
Related articles
- Elevate: Concept overview of how Elevate works and its key concepts.
- The Elevate investigation method: How Elevate selects a verdict among the ones available in your workspace.
- Override an Elevate verdict: How analysts change the verdict Elevate reached.
- Manage your Elevate runs: How to monitor and optimize your monthly run pack.
- Custom verdicts: How to define verdicts and the verdict stage they belong to.
- Custom statuses: How to define the statuses your team uses to close alerts.