Interpret asset risk scores
Reveal module — This feature requires the Reveal add-on module.
Use the Asset Risk Score to prioritize host assets during triage and investigation. Review the score breakdown, contributing views, and score trajectory together before deciding what to investigate or remediate.
Read the scoring model first
For the score formula, score bands, exposure rules, recent activity decay, and criticality factors, see Asset risk scoring. This article focuses on using the score in the Sekoia interface.
Before you start
Make sure that:
- You have access to Reveal.
- The host asset is onboarded and associated with its available security data.
- Vulnerability and hygiene sources are reporting data when you expect those signals to affect the score.
- You understand that the displayed score includes a last updated timestamp and may not reflect a change until the platform processes the new data.
Open the asset context panel
You can open the asset context panel from an investigation or from the asset inventory.
Open the panel from an alert, event, or case
- Open the alert, event, or case that contains the asset.
- Select the affected host or another asset field.
- Open the asset context panel.
Open the panel from the asset inventory
- Go to Configure > Assets.
- Locate the host asset.
- Open its asset context panel.
Read the score in the header
The header displays the current Asset Risk Score and its severity band. Note the Criticality, First seen, Last seen, and Last updated values before you interpret the score.
The score band provides the first prioritization signal. For the exact score ranges and labels, see Understand the score bands.
Review the score breakdown
The Overview tab separates the final score into the three values that explain the current priority.
- Open the Overview tab.
- Locate the asset risk breakdown.
- Compare Exposure with Recent activity.
- Review the Base score.
- Review the Criticality multiplier.
- Check the Last updated timestamp.
Use the largest displayed contribution as the starting point for your investigation. The overview may also display a message such as Score mostly driven by: Exposure (51%).
For the calculation details, see:
- Understand the Exposure Score
- Understand the Recent Activity Score
- Understand the Criticality Factor
Inspect persistent exposure
Persistent exposure comes from vulnerabilities and hygiene findings.
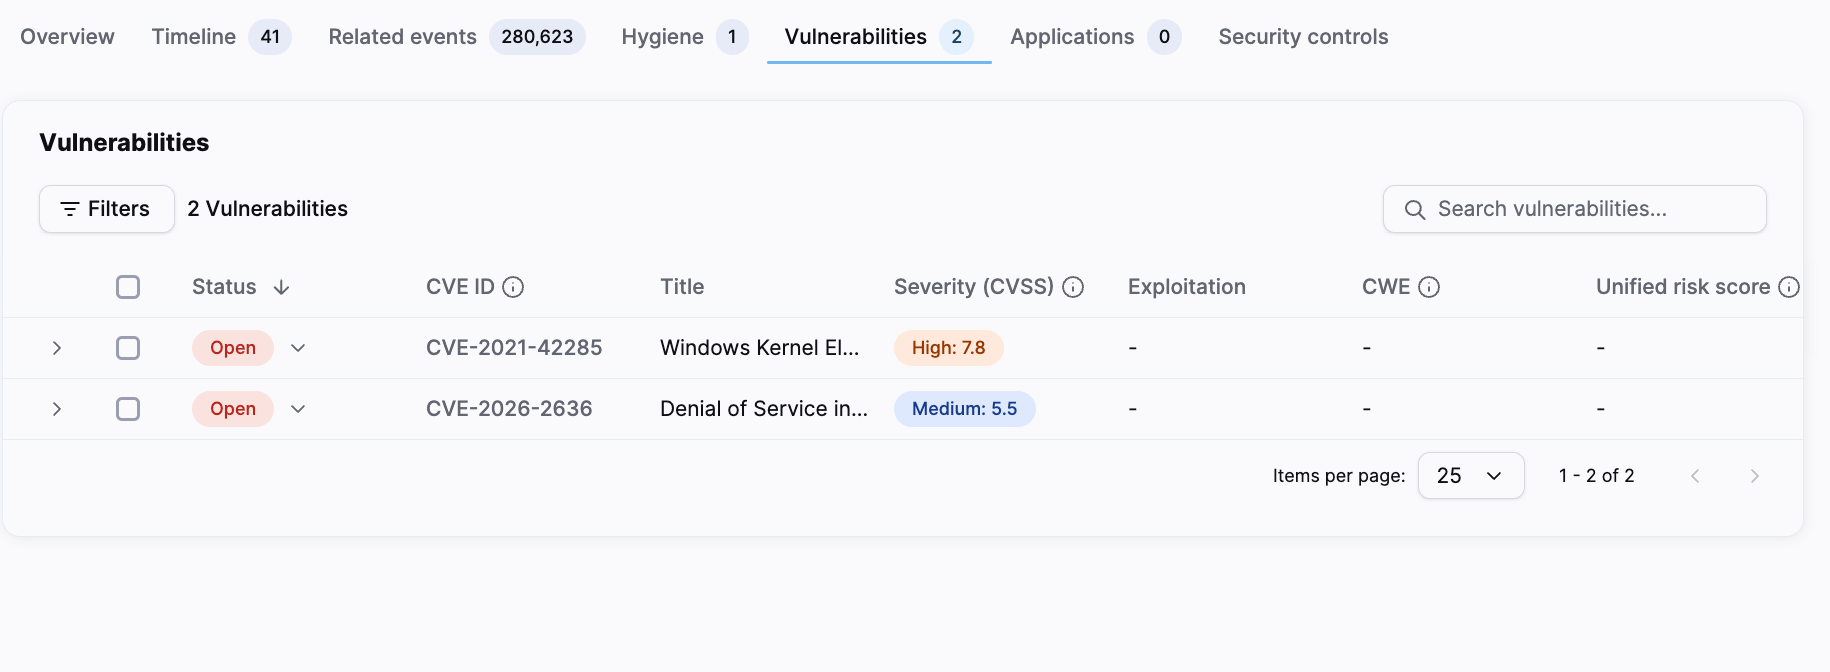
- Open the Vulnerabilities tab to review open CVE exposures.
- Review the vulnerability status, CVE ID, title, severity, and CWE values.
- Check the Unified risk score column when it is available for an individual vulnerability.
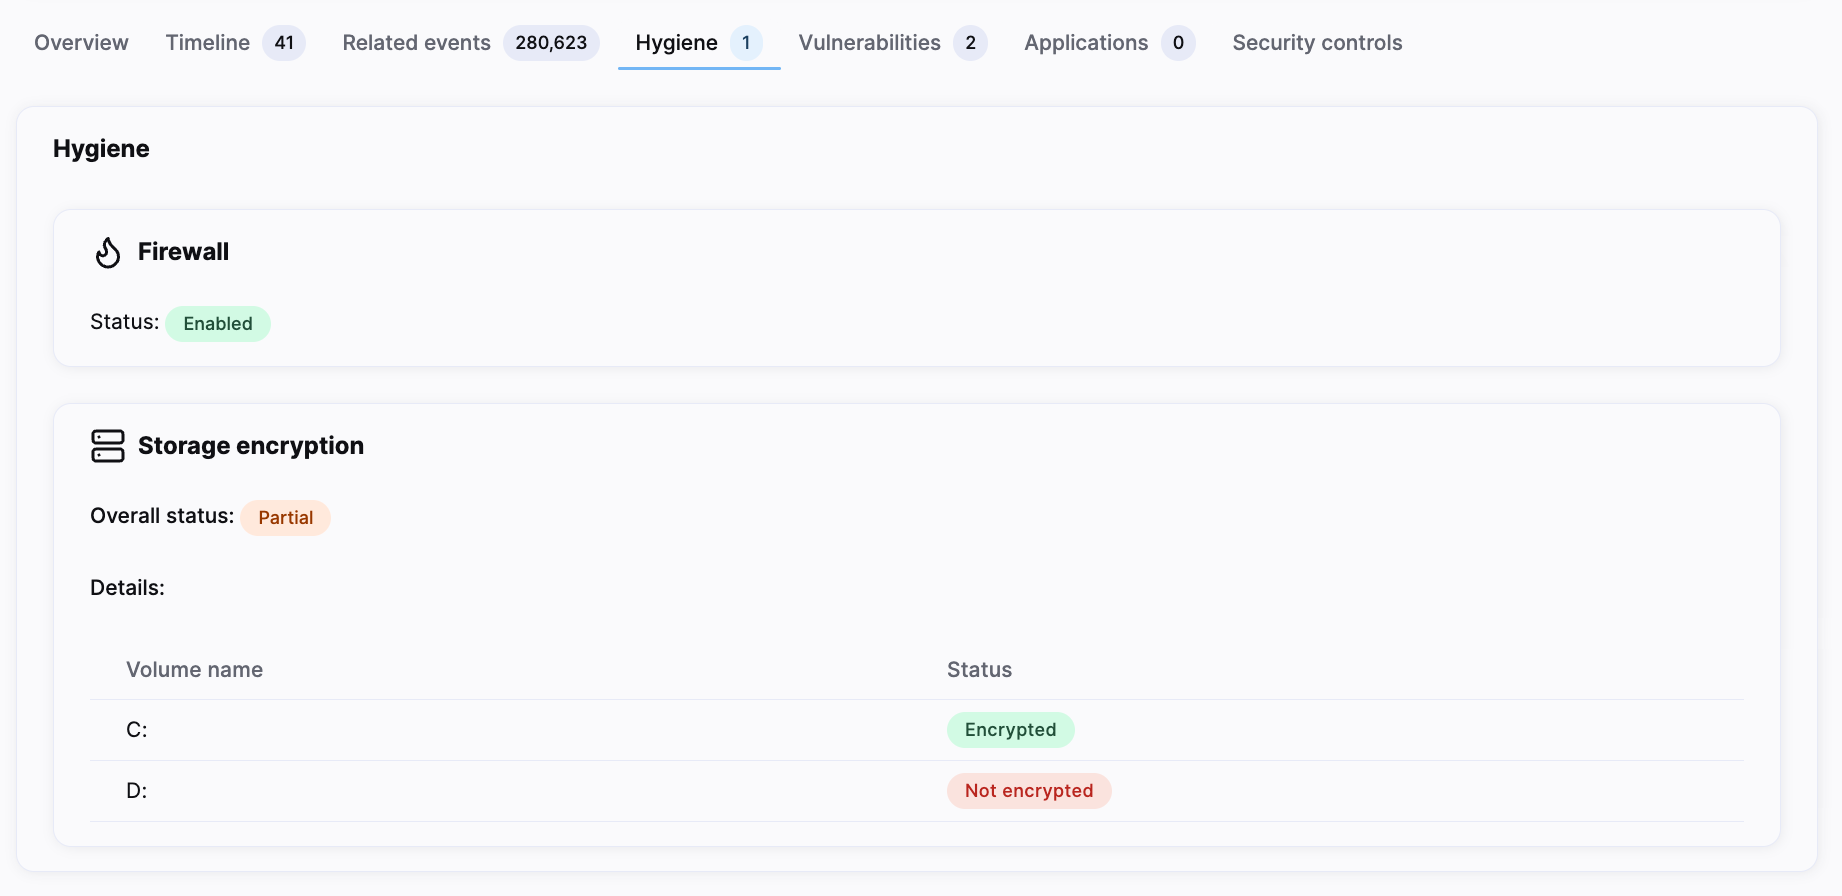
- Open the Hygiene tab to review firewall and storage encryption states.
- Check whether the finding is still confirmed by a recent data update.
The Unified risk score belongs to the individual vulnerability. It is distinct from the host's Asset Risk Score and does not replace the asset-level breakdown.
For the rules that determine how vulnerabilities and hygiene findings affect Exposure, see Understand the Exposure Score.
Inspect recent activity
Recent activity includes cases, alerts, and Points of Interest (POIs). Their contributions are time-sensitive and may change as signals age or move through their lifecycle.
- Open the Timeline tab.
- Review entries for cases, alerts, and POIs.
- Check the state and age of each contributing signal.
- Open the relevant item when you need its full context.
When a case is linked to an alert, the case takes precedence and the linked alert does not contribute separately. A repeated correlated signal refreshes its timer but does not add another full-strength contribution.
For the decay and correlation rules, see Understand the Recent Activity Score.
Review related events
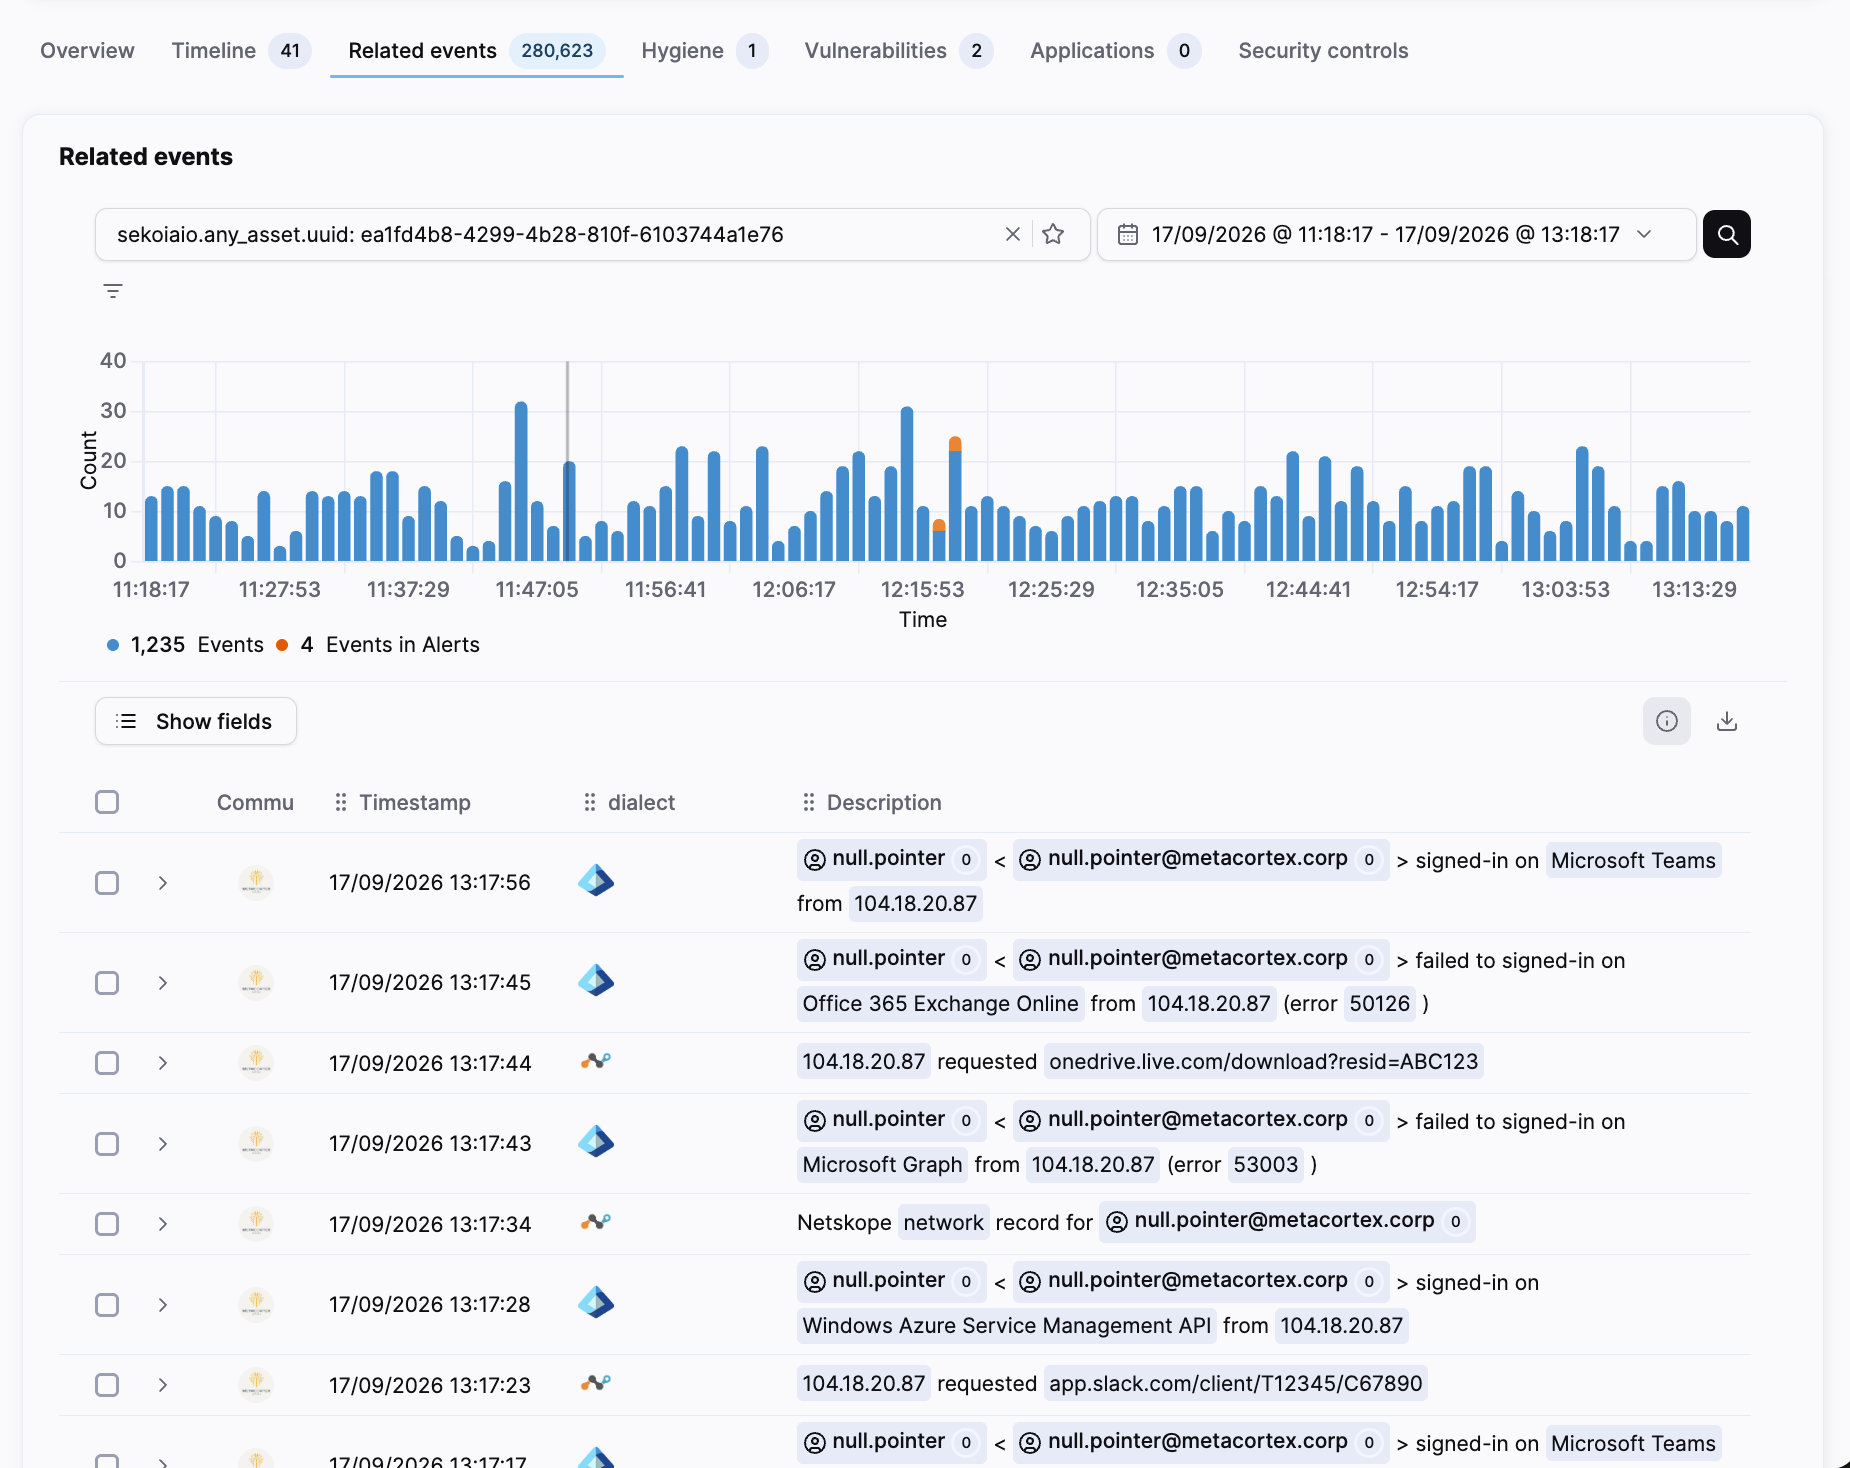
- Open the Related events tab.
- Review the event count and selected time range.
- Inspect the event list for the associated connector, timestamp, description, and alert association.
- Use the event details to validate the recent activity that appears in the score breakdown.
The Related events count represents events associated with the asset. It is not a count of installed applications.
Check the criticality adjustment
Criticality represents the business importance of the asset. It is applied after the technical and activity signals have been combined.
- Check the Criticality value in the asset header.
- Identify the criticality label.
- Review whether the multiplier reduced, preserved, or increased the final score.
For the criticality ranges and factor behavior, see Understand the Criticality Factor.
Default criticality
A criticality value of 0 is displayed as Default and applies It applies a factor of 1.00, so it does not change the Base Score. It does not mean that the asset has no technical exposure.
Change asset criticality
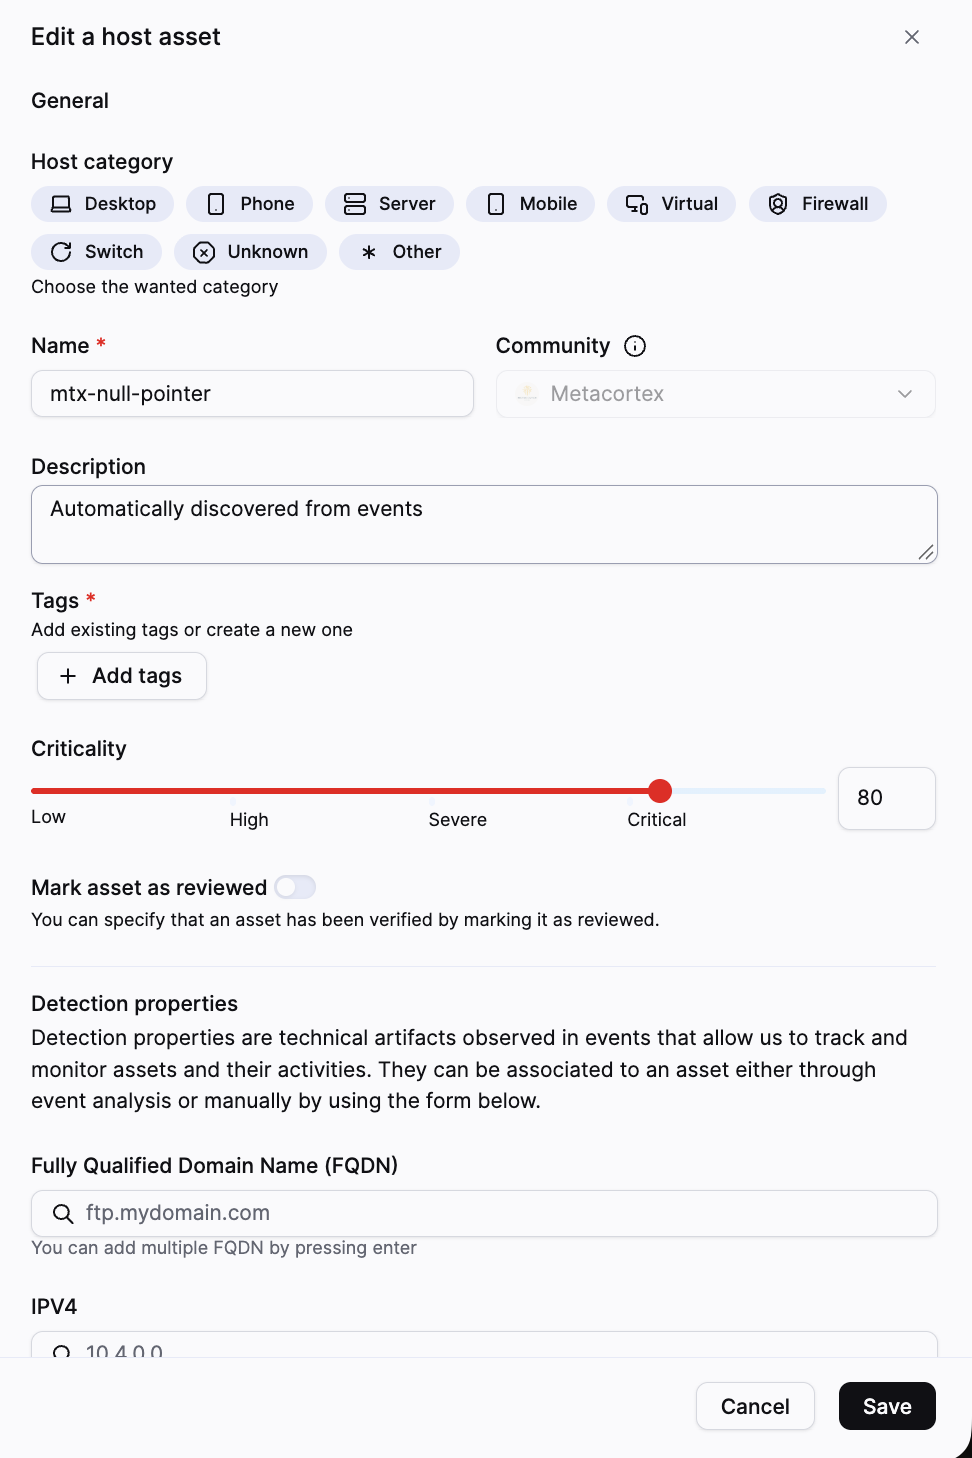
Change criticality when the asset's business importance has changed or the current value is not accurate.
- Open the asset context page: from the asset score panel, click on Edit.
- In the asset context page, click Edit.
- Locate the Criticality control.
- Select the value that reflects the asset's business importance.
- Click Save.
The updated criticality changes the final prioritization. It does not create or remove vulnerabilities, hygiene findings, alerts, cases, or POIs.
Review the score trajectory
Use the trajectory graph to understand whether the asset's current priority is increasing, stable, or decreasing.
- Open the Timeline tab.
- Review the Risk score trajectory graph.
- Select a time range when you need to compare a longer or shorter period.
- Hover over a point when you need the score value and timestamp.
- Compare visible changes with the timeline entries below the graph.
The graph shows the Asset Risk Score over time. It does not add a separate marker for every case, alert, POI, vulnerability event, hygiene event, or criticality change.
The timeline below the graph records meaningful score-driving changes. Use it to identify what caused the score to rise, fall, or stop contributing.
Act on the result
Use the dominant contributor to choose the next investigation or remediation step.
| Main driver | Next focus |
|---|---|
| Exposure | Review open vulnerabilities and hygiene findings. Confirm whether the data is current and remediate or update the relevant finding status. |
| Recent activity | Review the linked case, alert, or POI. Check its state, verdict, age, and correlation with other signals. |
| Criticality | Confirm that the asset's business importance is accurate. Adjust the asset criticality when required. |
The score supports prioritization. It does not determine whether an incident has occurred or whether an asset is compromised. Use the detailed asset context, investigation data, and your organization's response procedures before taking action.
Related articles
- Asset risk scoring: Overview of the score model, inputs, decay rules, and criticality factor.
- Asset context panel: How to open and use the core asset investigation surface.
- Asset context panel, Reveal capabilities: Overview of Reveal-specific asset context, including hygiene, vulnerabilities, Points of Interest, and security controls.
- Assets: Reference for asset categories, criticality, and asset management.