Navigate the playbooks interface
The Playbooks page lets you create, organize, activate, and monitor playbooks. This article describes the playbooks list, playbook details, workflow editor, runs, trigger logs, and version history.
Playbooks list
The Playbooks page lists the playbooks available in your community, sorted by the last update. From this page, you can create playbooks, manage their connected accounts, and monitor their runs.
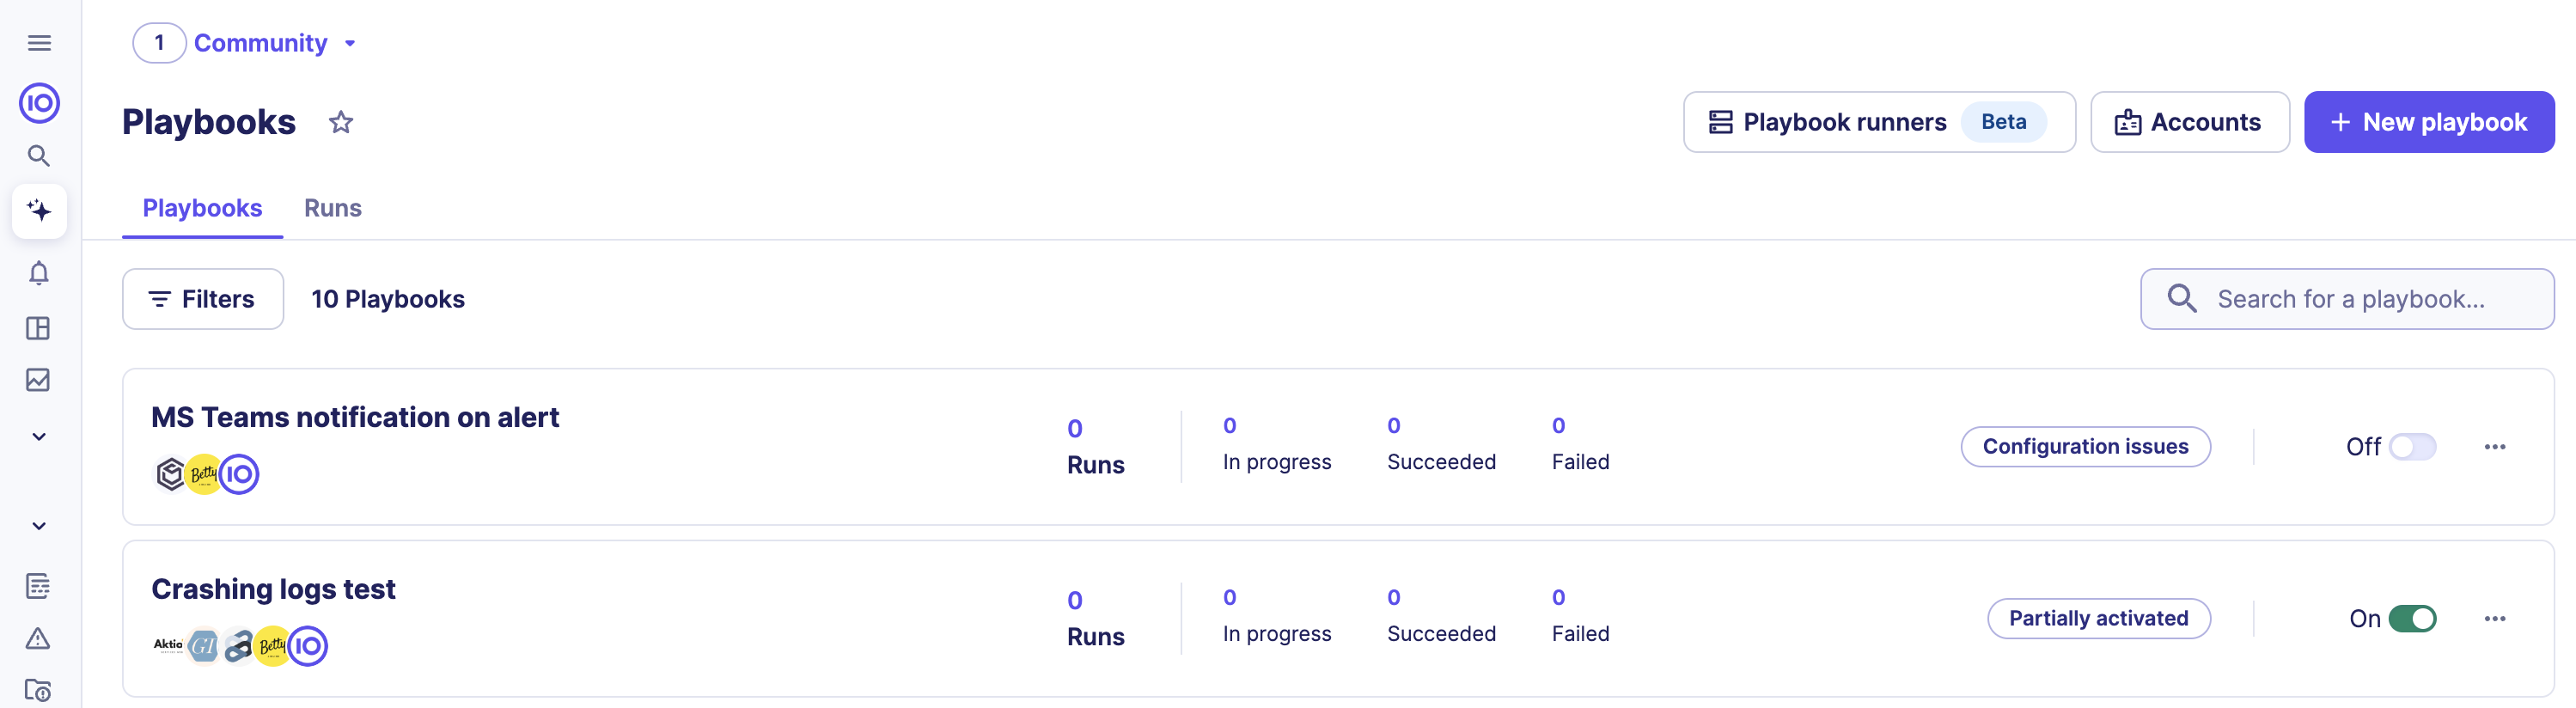
Header actions
| Button | Action |
|---|---|
| Local runners | Manage the runners that execute playbook actions in your own infrastructure. See Playbooks On-premises. |
| Connected accounts | Manage the accounts that playbooks use to connect to third-party services. See Manage accounts. |
| New playbook | Create a playbook. See Build playbooks. |
The Playbooks tab lists playbooks. The Runs tab lists the runs of all playbooks.
Table columns
| Column | Content |
|---|---|
| Name | Name of the playbook. Click the name to open the playbook. |
| Status | Status badges for the playbook. Click a badge to open the corresponding tab. |
| Runs, In progress, Succeeded, Failed | Counters for the playbook runs. |
| Custom fields | Custom field values assigned to the playbook. See Organize playbooks with custom fields. |
| Communities | Communities where the playbook runs. |
| Author | User who created the playbook. |
| Updated at | Date of the last change to the playbook. |
| Activated | Toggle to activate or deactivate the playbook. |
| Actions | The ... menu, with Duplicate playbook and Delete. |
The Name and Status columns are always displayed. The Actions column is always the last column. To choose and reorder the other columns, click Show/Hide table columns, select the columns, and drag them into the order you want. Sekoia.io saves your selection for the current community in your browser.
Search, filter, and sort
- To find a playbook by name, enter a name in the search bar.
- To filter the list, click Filters and select Activation, Integrations used, Trigger, or Updated at. Active filters remain in the URL, so you can bookmark or share a filtered view.
- To sort the list, click the Name, Activated, or Updated at column header.
Group playbooks
To group the table by activation, community, or custom field, click Group by. See Organize playbooks with custom fields.
Activate, duplicate, or delete a playbook
These actions require permission to edit playbooks.
Deactivating a playbook
Deactivating a playbook stops it in all its communities and ends its runs in progress.
- To activate or deactivate a playbook, click the toggle in the Activated column.
- To duplicate a playbook, click ... at the end of its row, then select Duplicate playbook.
- To delete a playbook, deactivate it first. Then click ... at the end of its row and select Delete.
Card view
The playbooks list is also available as cards. To switch views, click Card view or Table view next to the search bar. Sekoia.io remembers your choice in your browser. Group by and Show/Hide table columns are available only in table view.
Playbook details
To open a playbook, click its name in the playbooks list. Warning icons identify tabs and blocks that need attention before you can activate the playbook.
You can save the playbook from any tab with Save in the playbook header.
Status badges
The following status badges indicate the state of a playbook:
| Status | Description |
|---|---|
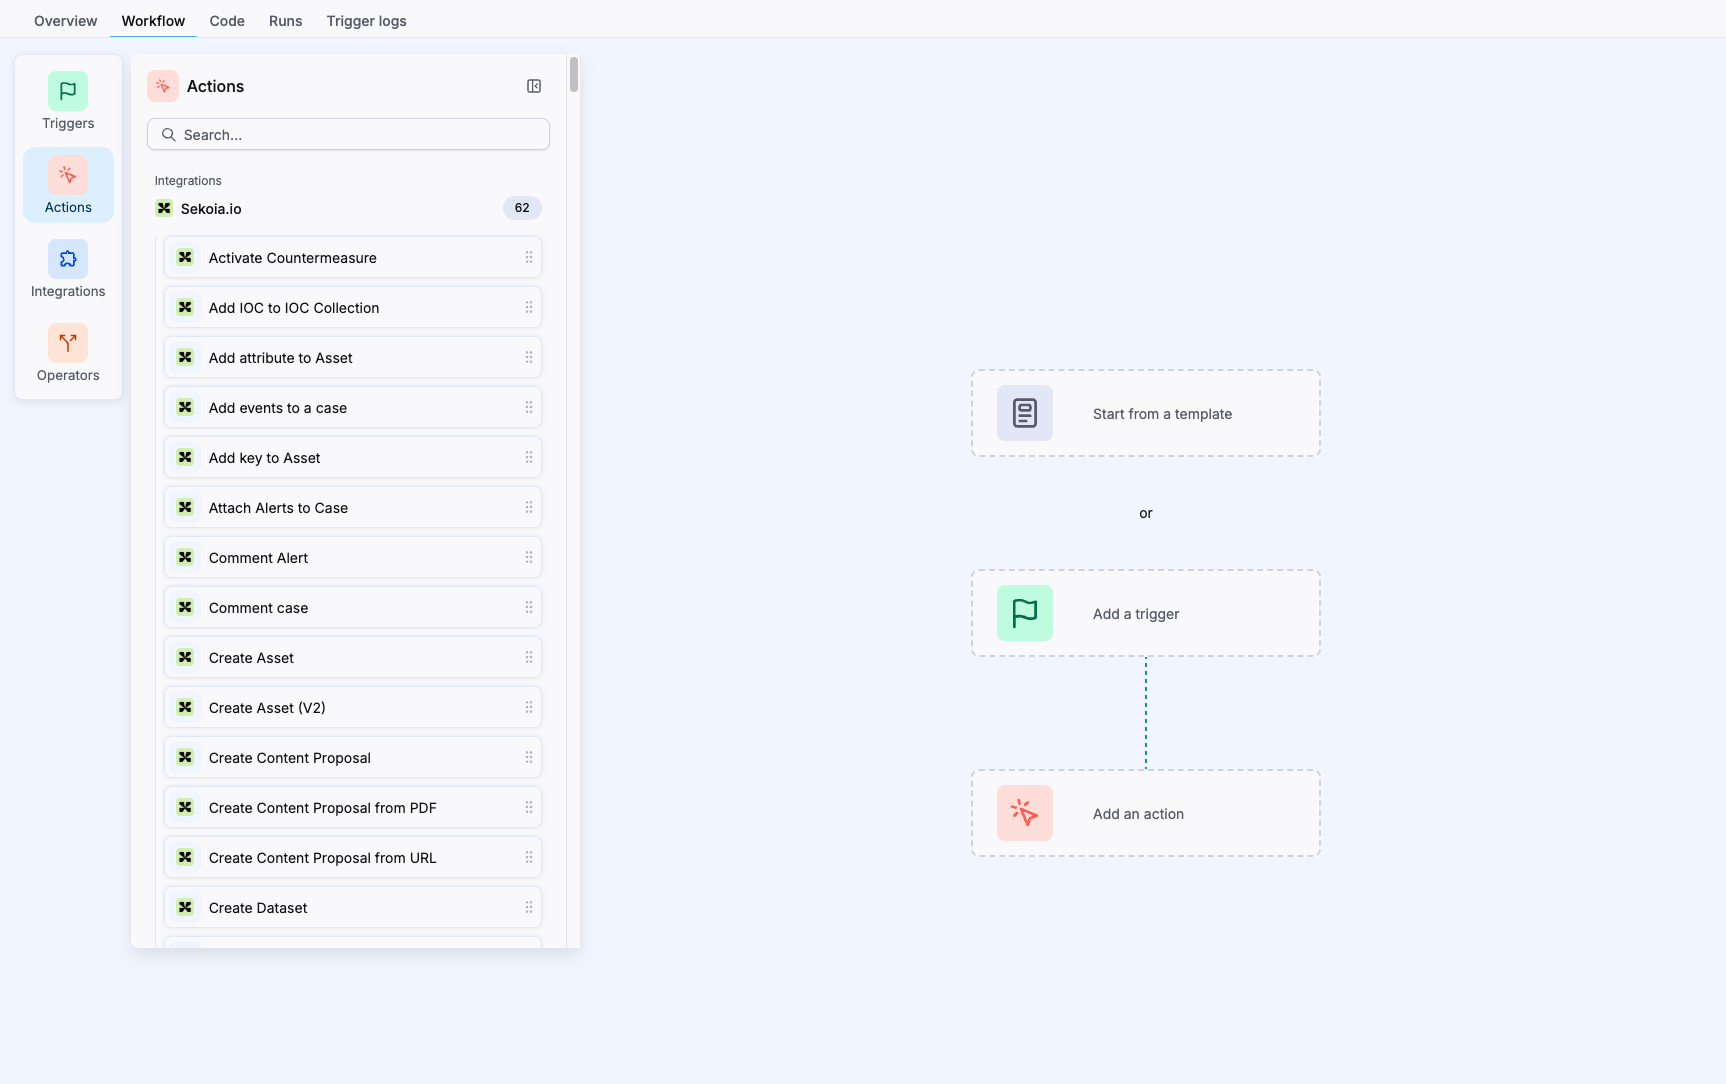
| Configuration issues | One or more communities have configuration issues. Click the badge to open the Workflow tab with the issue panel open. |
| Partially activated | The playbook is running in some communities but not all of them. Click the badge to open the Overview tab. |
| Ready to start | No community has configuration issues, and the playbook can be activated. |
| Failed runs | One or more runs have failed. Click the badge to open the Runs tab with a Failed filter applied. |
| Trigger crashed | A trigger configuration has a log with the Critical level. Click the badge to open the Trigger logs tab with a Critical filter applied. |
Overview
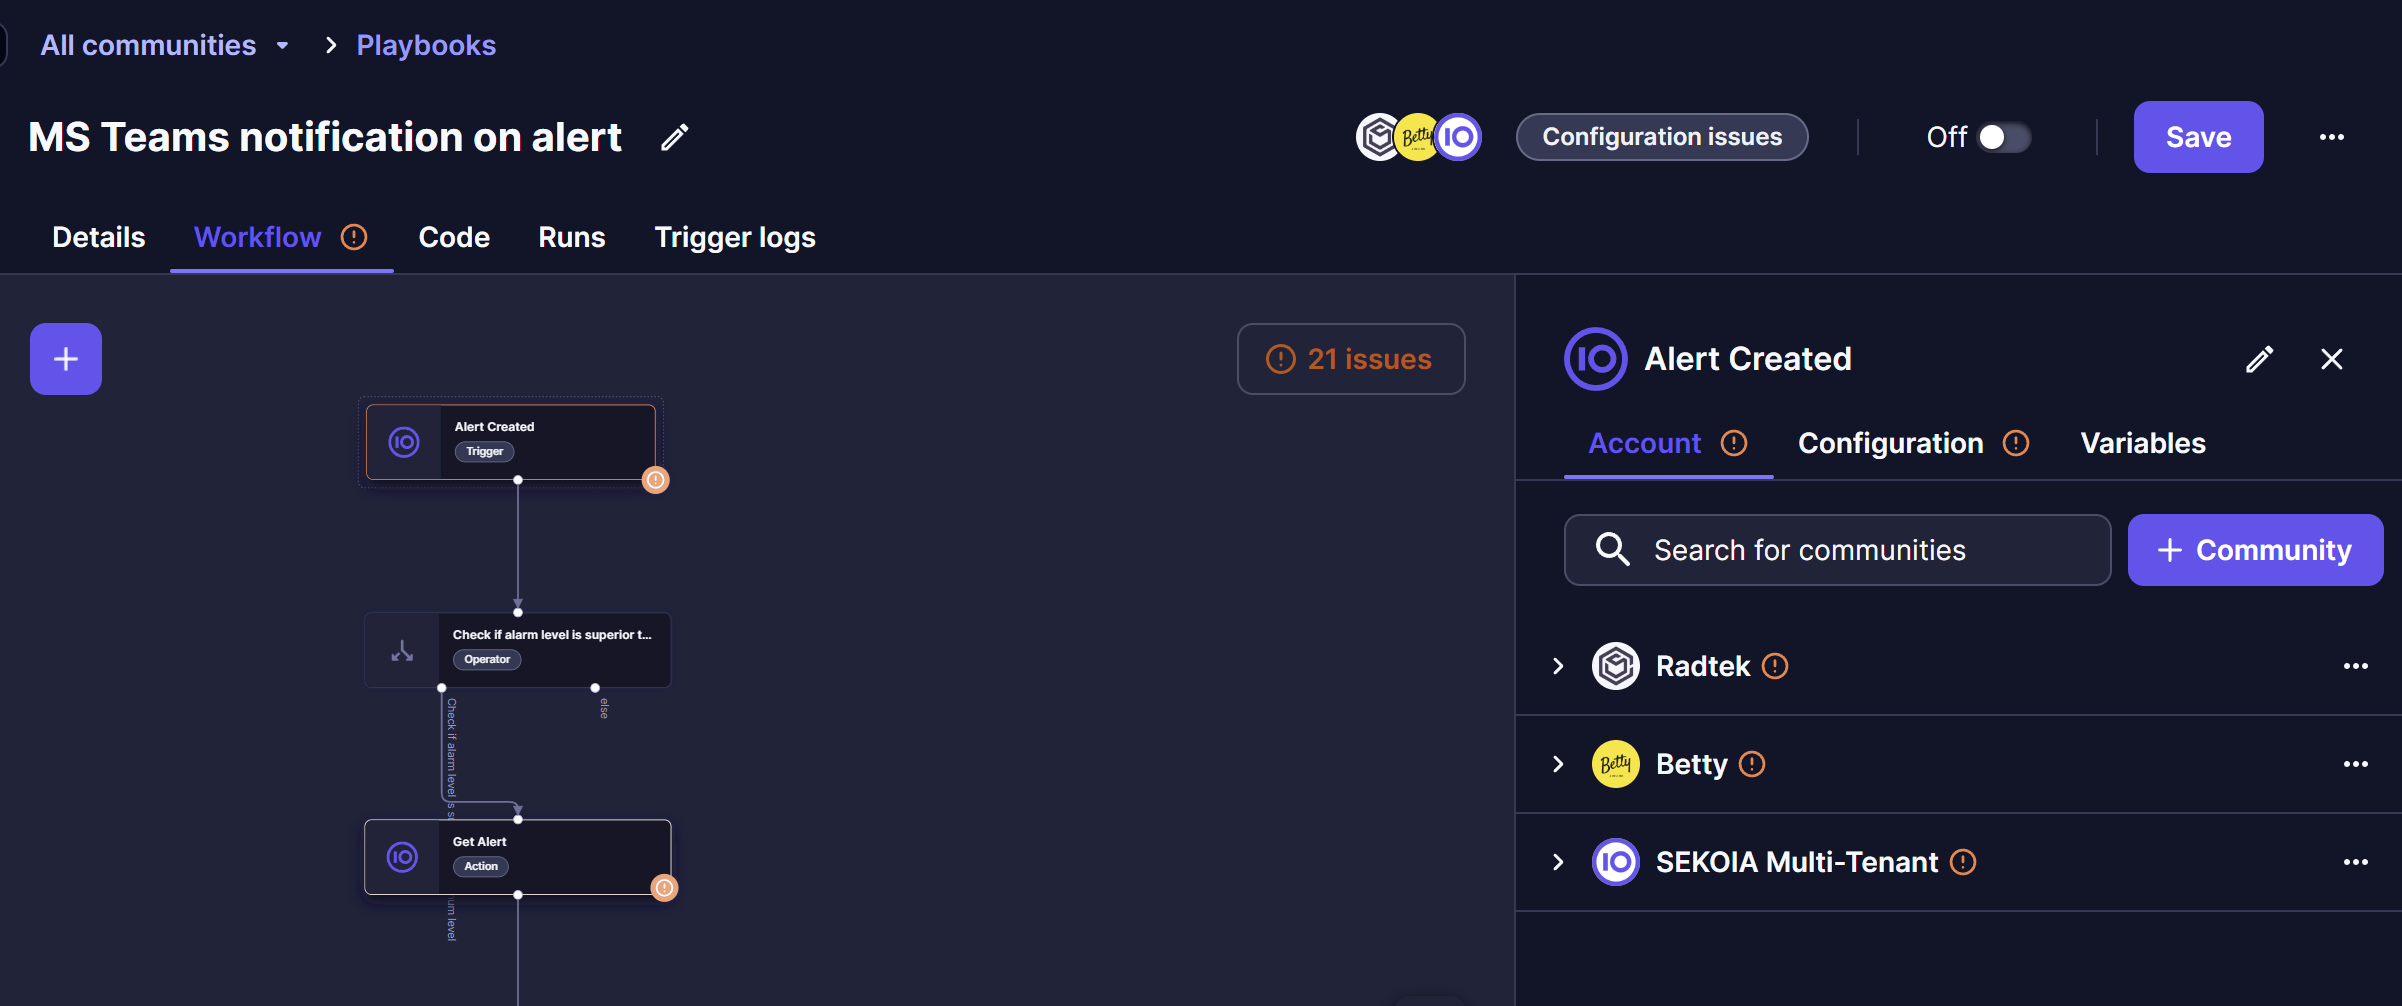
The Overview tab contains the following information:
- The community where the playbook was created.
- The user who created the playbook.
- The user who last updated the playbook.
- The creation date.
- The date of the last update.
- The user who last activated the playbook.
- The date of the last activation.
- The description of the playbook.
- Community details, including options to add or remove communities, activate or deactivate a community, and review the playbook status for each community.
- Custom fields assigned to the playbook. See Organize playbooks with custom fields.
Workflow
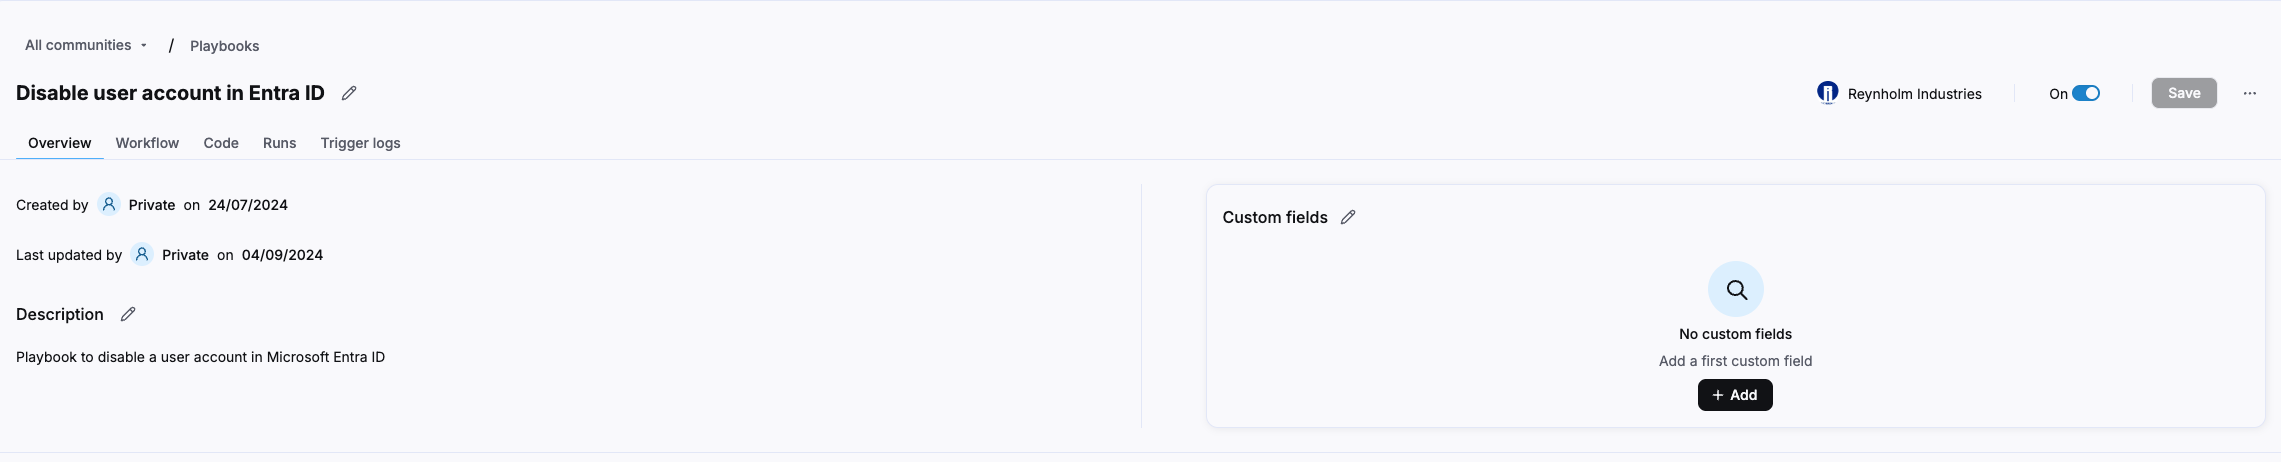
The workflow view contains the module menu, the graph area, and the configuration panel.
Module menu
The module menu provides the triggers, actions, and operators that you can add to a workflow. The menu contains Triggers, Actions, Integrations, and Operators buttons. Click a button to open its panel, then click it again to close the panel.
| Panel | Content |
|---|---|
| Triggers | A search bar, built-in triggers such as Cron, and triggers grouped by integration. |
| Actions | A search bar and actions grouped by integration. The panel displays the number of actions for each integration. |
| Integrations | Integrations connected to Sekoia.io. Click an integration to view its triggers and actions. |
| Operators | The Condition, Foreach, Store, All, and Any operators. |
To add a module to the workflow, click it or drag it to the graph area. The module becomes a block.
To insert a block between two existing blocks, click the + on the link between them. Then select Add an action or Add an operator.
Note
Configuration details for these blocks are available in the Library section of the documentation.
Graph area
The graph area is where you add and connect blocks to build a playbook.
Each block displays:
- The logo of the application or service.
- The name of the action.
- The block type, such as Action, Operator, or Trigger.
- The block status, such as Valid or In error.
- Connectors.
| Control | Description |
|---|---|
| Zoom in or out | Zoom the graph with the mouse or the zoom controls. |
| Fit diagram | Display all blocks in the graph area. |
| Undo | Undo the last action. |
| Redo | Redo an action. |
Note
If a block has missing configuration, an alert showing the number of errors appears in the graph area.
During a playbook run, colors indicate the status of blocks and nodes:
| Color | Meaning |
|---|---|
| Green | The playbook run completed successfully. |
| Orange | The playbook run left this node. |
| Red | The run ended with an error. |
Configuration panel
Click a block in the graph area to open its configuration panel. The panel content depends on the block type.
Triggers
You can edit the trigger name in the header.
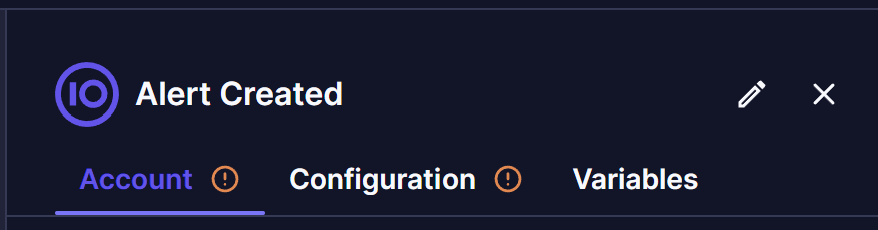
| Tab | Content |
|---|---|
| Account | Module configurations that you can create, edit, or delete. In a Managed Security Service Provider (MSSP) workspace, you see one account for each community. |
| Configuration | Available trigger configurations that you can add, edit, or delete. |
| Variables | Variables and their values. |
In an MSSP workspace, the Account and Configuration sections contain a section for each community included in the playbook.
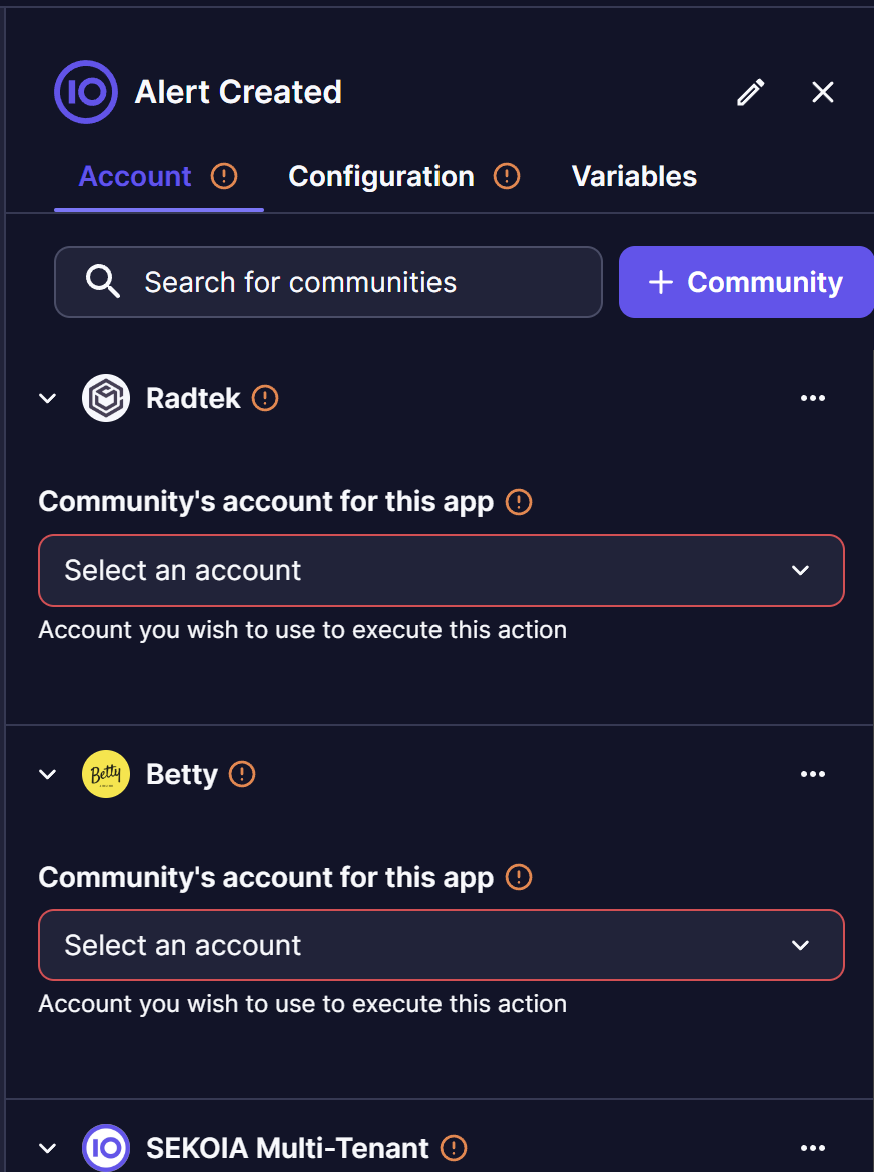
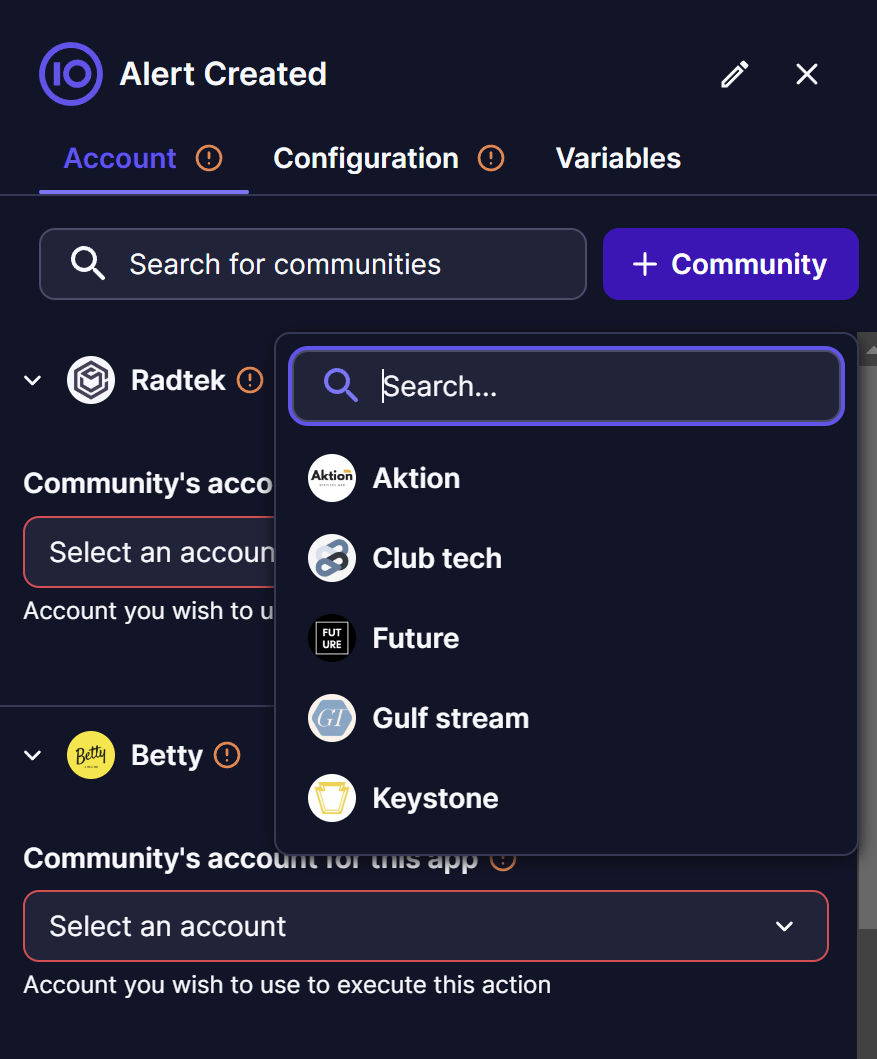
To add a community, click + Community, then select one of your remaining communities.
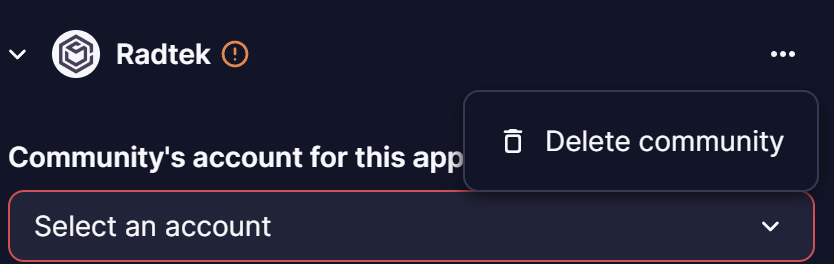
To remove a community, click ... in the community section header, then select Delete community.
Operators
Condition
| Section | Content |
|---|---|
| Name | Name of the operator. You can edit this value. |
| Cases | Comparisons made with a variable or with values entered in a form. |
Foreach
| Section | Content |
|---|---|
| Name | Name of the operator. You can edit this value. |
| Items | Data processed by the operator. |
| Variables | Variables related to the action, including their names, descriptions, and a copy button. |
Store
| Section | Content |
|---|---|
| Name | Name of the operator. You can edit this value. |
| Modifications | Modifications to apply. To add a modification, hover over the title and select Use variable or Add one entry to array. |
| Use a variable | Field where you enter the value of a variable. |
| Add form | Form with the Key, Type, and Value fields. See the Store operator reference. |
Actions
You can edit the action name in the header.

| Tab | Content |
|---|---|
| Account | Existing configurations that can apply to the action. If no configuration is available, click Create new configuration. In an MSSP workspace, you see one account for each community. |
| Configuration | Configuration steps for the selected action, including a search bar. You can extend the height of a field by dragging its lower-right corner. |
| Variables | Variables related to the action, including their names, descriptions, and a copy button. |
Note
To resize the configuration panel, drag its left edge. Sekoia.io remembers the selected width for later configurations.
In an MSSP workspace, the Account tab contains a section for each community included in the playbook.
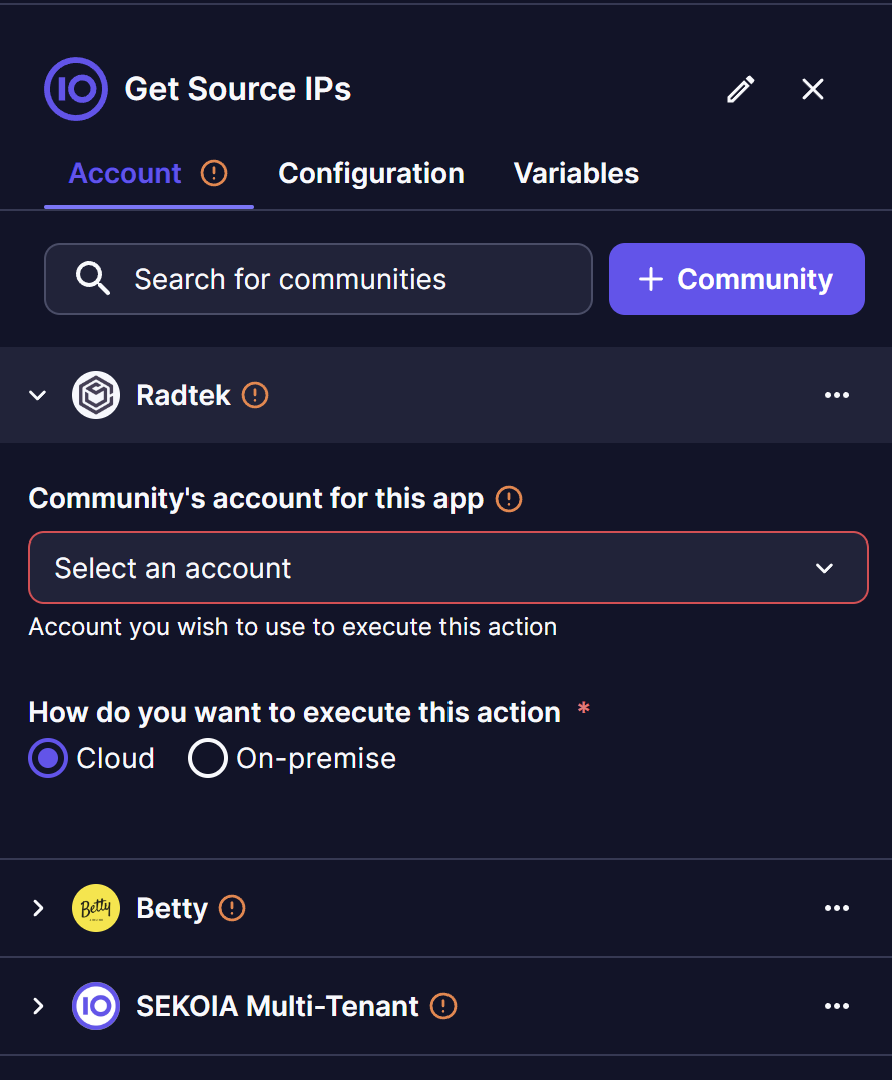
For information about adding or removing communities, see the Triggers section.
Issue panel
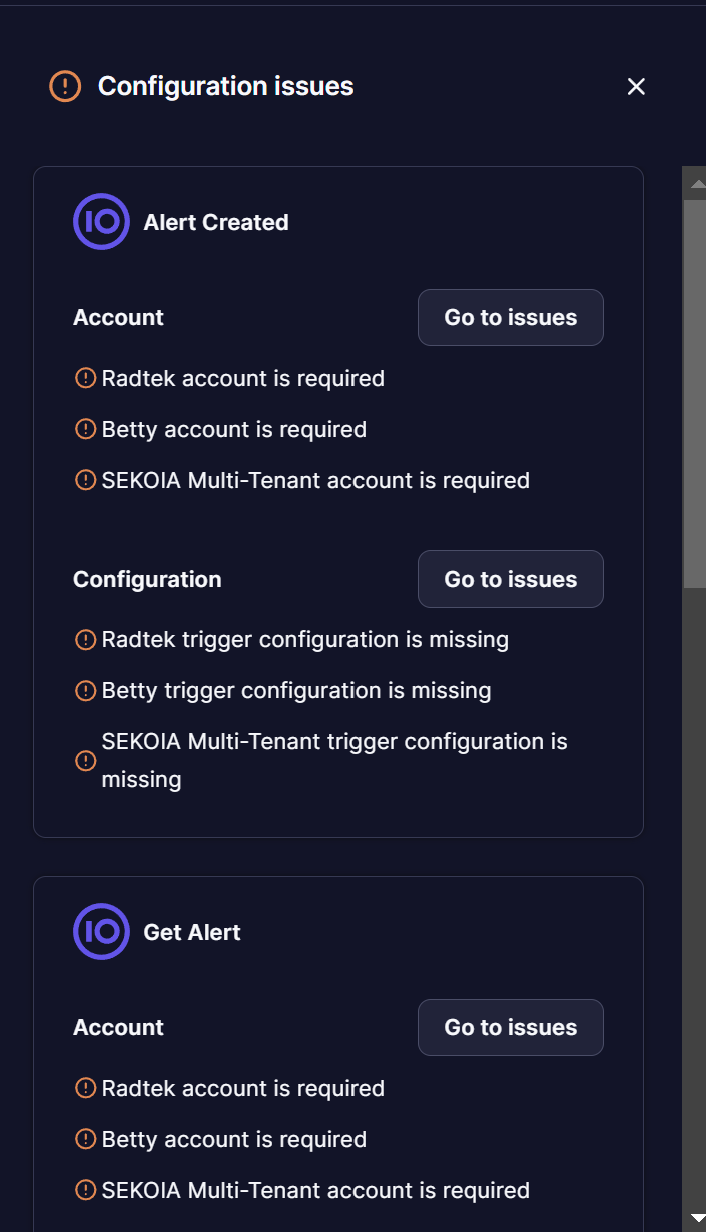
In an MSSP workspace, the issue panel lists configuration issues for each community. Click Go to issues to open the relevant module and the Account or Configuration tab where you can resolve the issue.
Code
The Code tab displays the playbook in JSON. You can use Jinja 3 to fill variable fields.
From this tab, you can compare the JSON of a previous version with the current version. See Restore a playbook version.
To test a Jinja expression against a JSON file:
- Copy the relevant JSON from the playbook.
- Save it as
file.json. - Run the following Python script:
import json
from jinja2 import Template

file_json = open("file.json", "r")
loading = json.load(file_json)

jinja_pattern = "{{urgency.value}}"
template = Template(jinja_pattern)
message = template.render(urgency=loading["urgency"])
print(message)
Runs
The Playbook runs tab lists the runs from the last week.
The header displays the total number of runs, the number of runs in progress, the number of successful runs, and the number of failed runs.
The table includes the following information:
- The event that started the run.
- The start time.
- The run status.
- The run duration.
- A button to run the playbook again.
To open the details of a run, click the run. The graph view displays the status of each block.
To view the results for a block, click the block in the graph view. The Run results panel opens.
Use the filters to filter runs by Status. For meta-playbooks, you can also filter runs by Communities.
Run results
You can open run results from the Runs tab in the playbook or from the run details panel.
The panel displays:
- The run status.
- The timeline, including the start time, duration, and end time.
- Arguments.
- Results, including logs and errors.
To open the block settings, click Edit in the panel.
To return to the run results, click Switch to run results.
Trigger logs
The Trigger logs tab lists the logs from a trigger configuration. Use it to investigate configuration errors and trigger failures.
Use the filters to filter logs by Level, such as Critical, Debug, or Info. For meta-playbooks, you can also filter logs by Communities.
Version history
The ... menu in the playbook header gives access to Version history. The panel lists the last 30 saved versions, with the date and author for each version. You can preview, compare, and restore a version. See Restore a playbook version.
Related articles
- Build playbooks: How to create a playbook from a template or from scratch.
- Organize playbooks with custom fields: How to add custom fields to playbooks and group the playbooks list.
- Restore a playbook version: How to preview, compare, and restore a previous version of a playbook.
- Debug playbooks: How to investigate failed runs and trigger errors.